API Analytics
In this section, we have covered the API Statistics available in the Insight tab under the Admin Console which represents the analytics report for requests made to various types of CRUD APIs. This contains useful charts and analytic tools to view and measure the overall performance of your site in terms of the number of API requests made and search history is now available for up to 30 days.
The information is aggregated and categorized into Request Count, Response Code, and Performance analysis. This analytics will be helpful to improve the overall application performance and understand the customer experience.
Note: This feature is an add-on and needs to be enabled by LoginRadius, please contact LoginRadius Support for details.
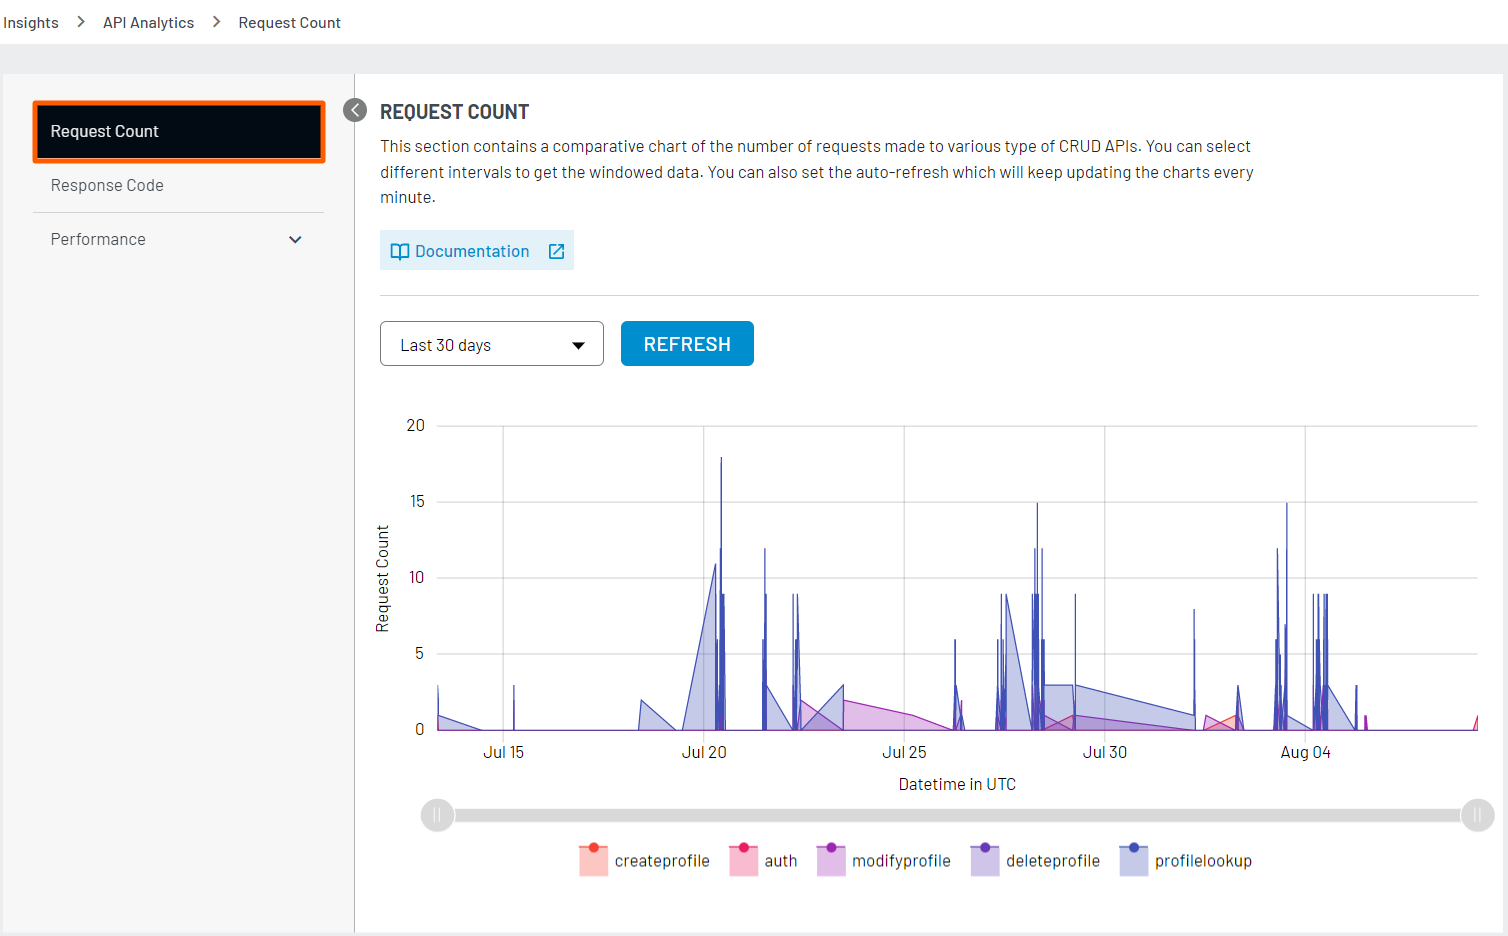
Request Count
This section contains a comparative chart of the number of requests made to various type of CRUD APIs. You can select different intervals to get the windowed data.
Response Code
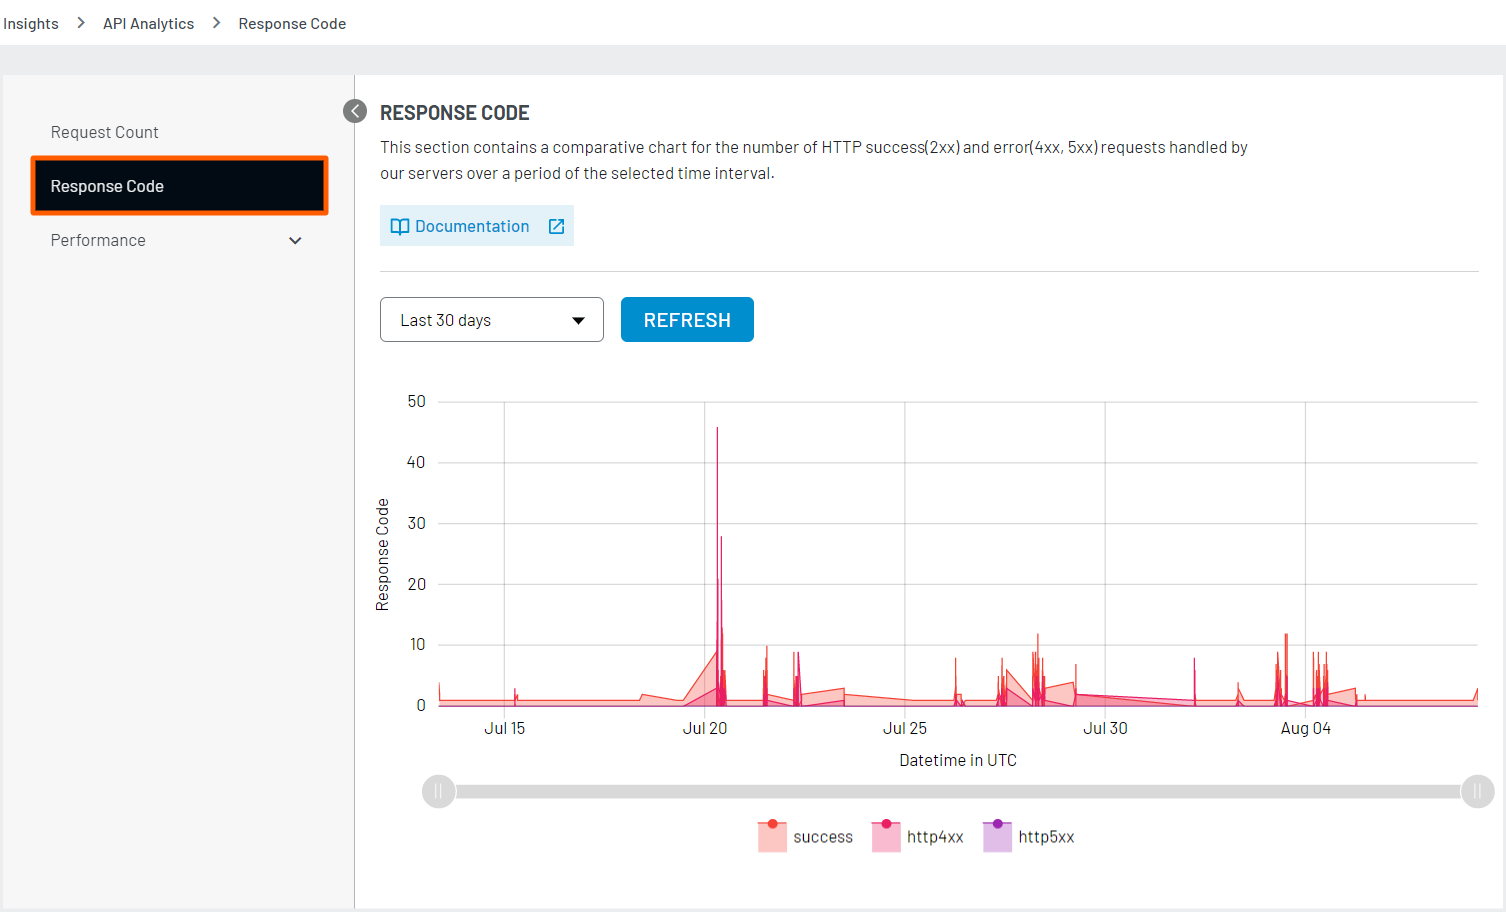
This section contains a comparative chart for the number of HTTP success(2xx) and error(4xx, 5xx) requests handled by our servers over a period of the selected time interval.
Performance
This section contains a comparative chart of the percentages of response time taken based on different APIs such as Profile lookup APIs, authentication APIs, profile creation APIs, profile deletion API, profile update APIs over a period of the selected time interval.
Lookup profile
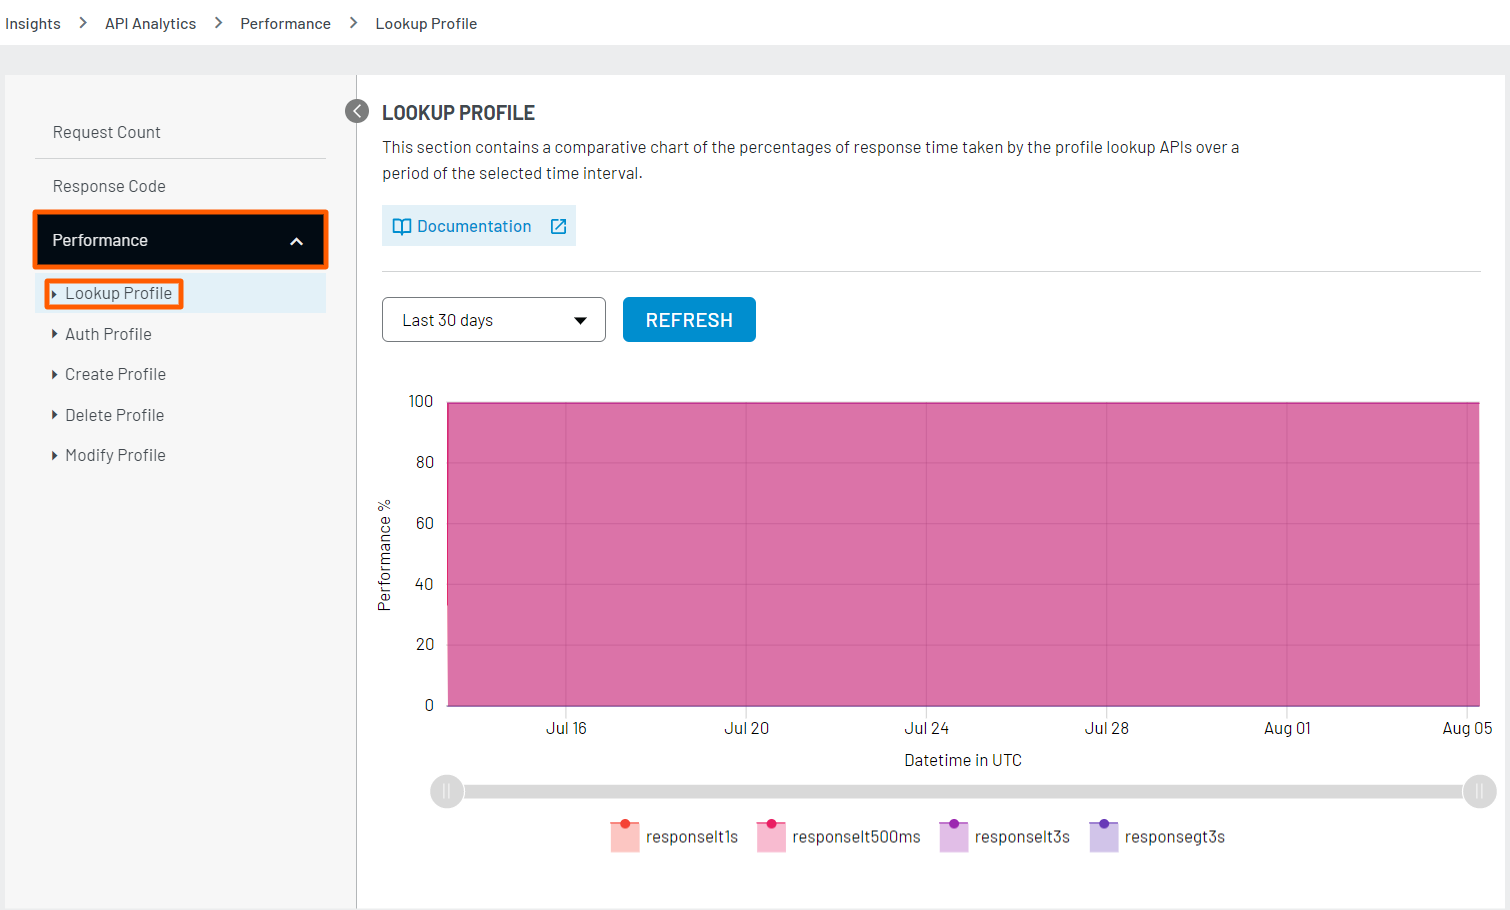
This section contains a comparative chart of the percentages of response time taken by the profile lookup APIs over a period of the selected time interval. It helps you track the exact time the LoginRadius API is taking to serve the specific amount of requests. It shows response time in multiple ranges like less then 1s, less then 500ms, less then 3s and greater then 3s. By clicking on a specific response time, you will be able to see the corresponding API stats..
You can also select the days/time from the provided drop down and once clicked on “REFRESH”, it will show the updated API performance. If you observe a higher percentage of APIs taking longer than usual (degraded response time), you should reach out to LoginRadius Support to have a look at it.

Auth Profile
This section contains a comparative chart of the percentages of response time taken by the authentication APIs over a period of the selected time interval. Similar to look-up profile analytics, this graph shows response time in multiple ranges like less then 1s, less then 500ms, less then 3s and greater then 3s. Further clicking on a specific response time, you will be able to see the corresponding API stats. If you observe any abnormal response time for the Auth API performance, you should reach out to LoginRadius Support to have a look at it.

Create Profile
If you want to know the LoginRadius account create APIs performance for a specific duration of time, you can refer to this section, as it contains a comparative chart of the percentages of response time taken by the profile creation APIs over a period of the selected time interval.
In general way we can say how much time the LoginRadius API is taking to create an account. Similar to other analytics, this graph also shows response times in multiple ranges like less then 1s, less then 500ms, less then 3s and greater then 3s. Further clicking on a specific response time, you will be able to see the corresponding API stats.

Delete Profile
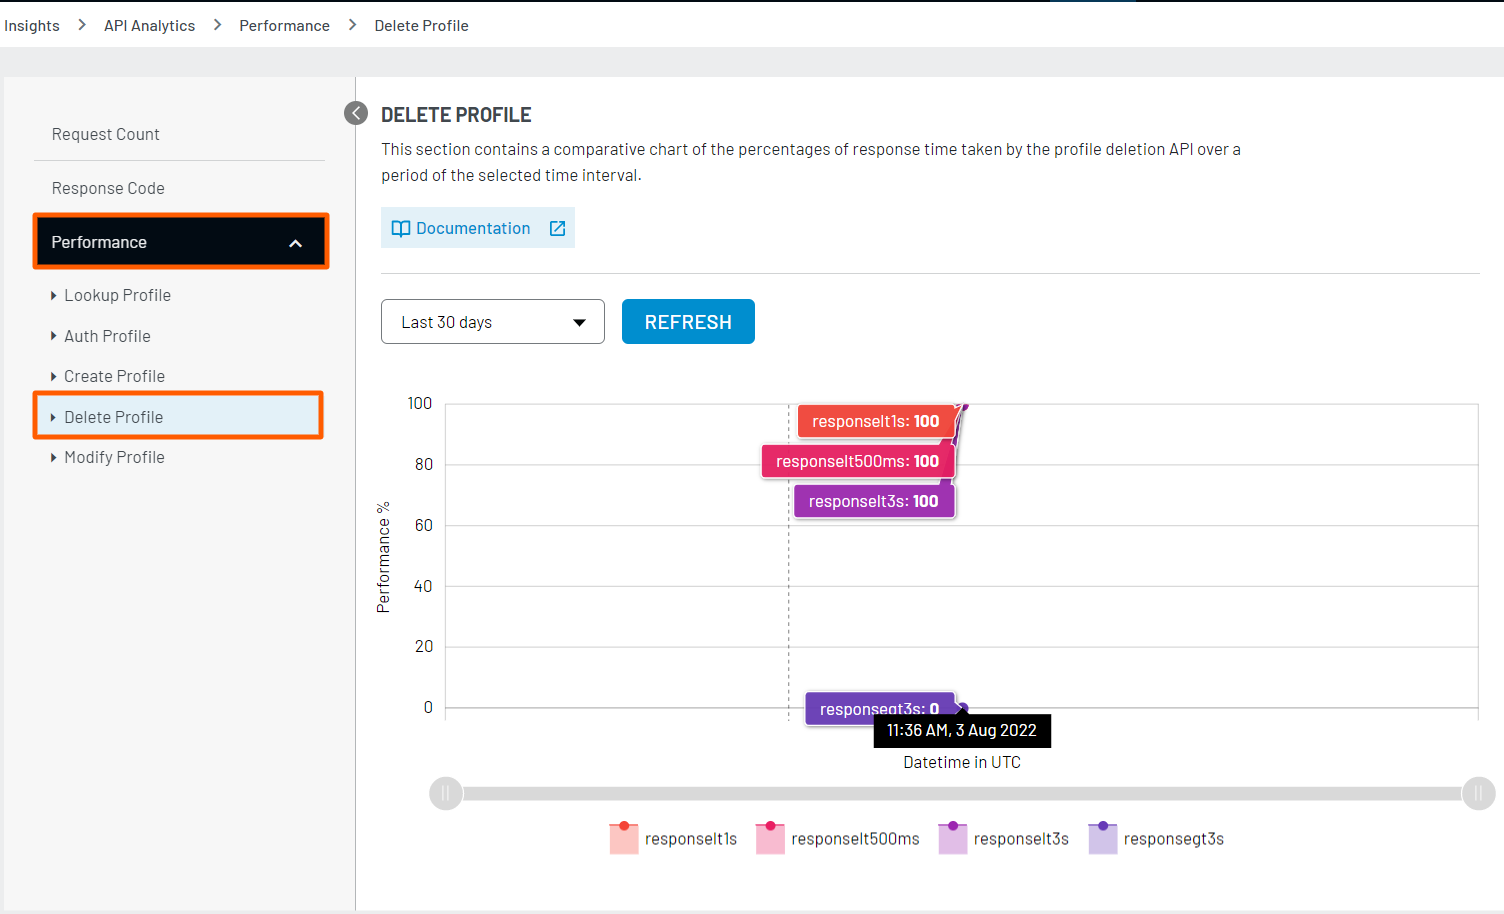
This section contains a comparative chart of the percentages of response time taken by the profile deletion API over a period of the selected time interval.
In general way we can say how much time the LoginRadius API is taking to delete an account. Similar to other analytics, this graph also shows response times in multiple ranges like less then 1s, less then 500ms, less then 3s and greater then 3s. Further clicking on a specific response time, you will be able to see the corresponding API stats.
Modify Profile
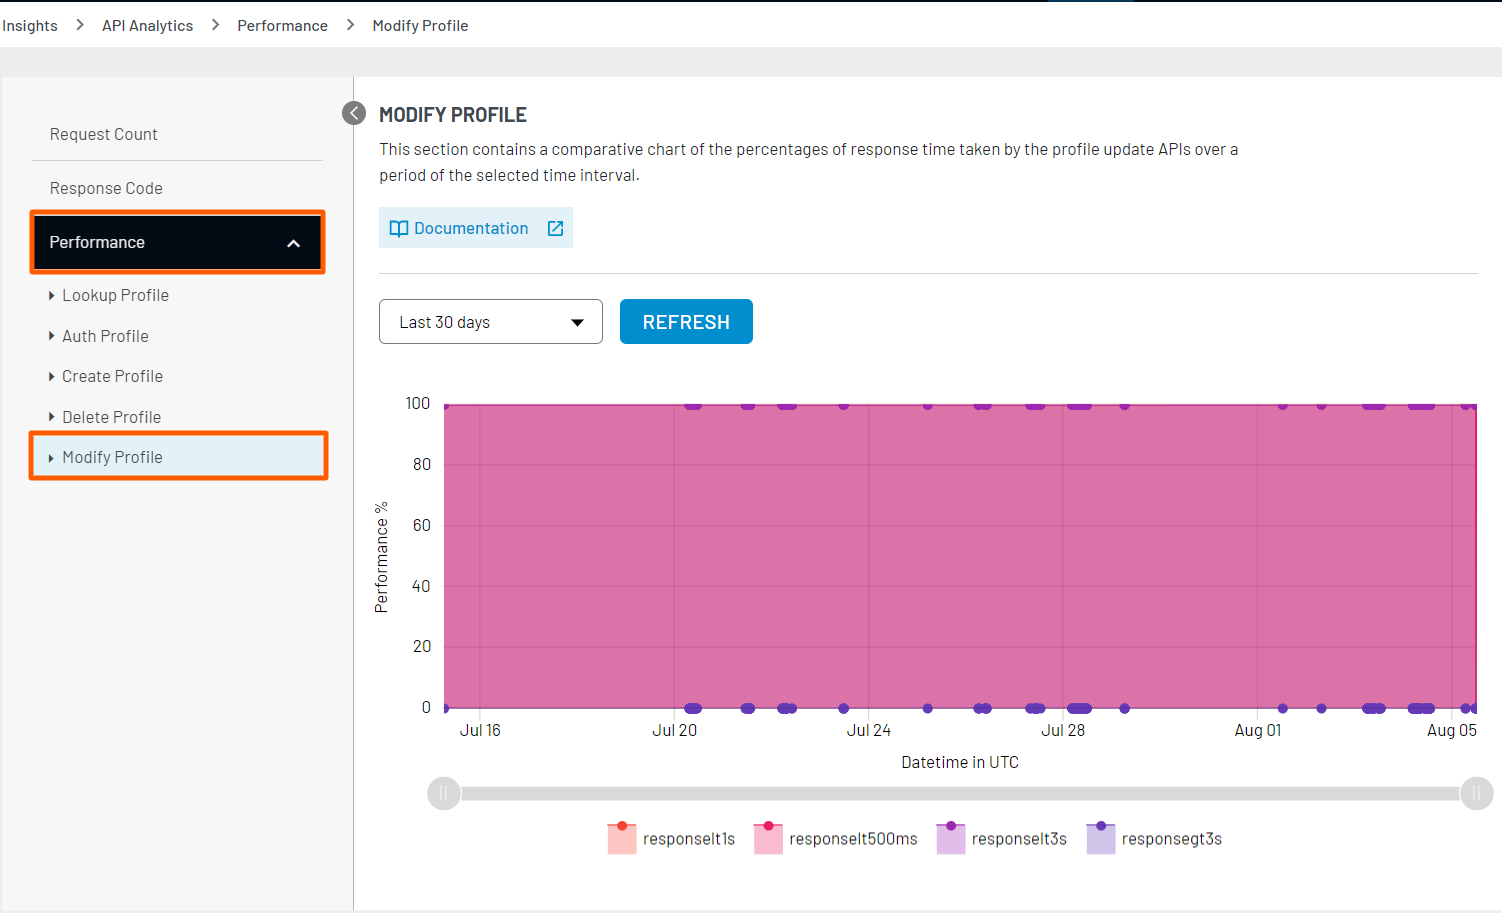
This section contains a comparative chart of the percentages of response time taken by the profile update APIs over a period of the selected time interval.
In general way we can say how much time the LoginRadius API is taking to update an profile. Similar to other analytics, this graph also shows response times in multiple ranges like less then 1s, less then 500ms, less then 3s and greater then 3s. Further clicking on a specific response time, you will be able to see the corresponding API stats.
